About the Report
This report offers a comprehensive overview of the UK foodservice delivery market, quantifying its size, growth, and key drivers. It features detailed analysis of leading operators and aggregators, highlighting how brands are adapting to shifting consumer expectations and market pressures. The report provides exclusive consumer insight from Lumina Intelligence’s Eating and Drinking Out Panel, tracking ordering habits, spending trends, and barriers to delivery use. With forward-looking projections, it also explores challenges such as aggregator fees, inflationary pressures, and demand for healthier options, ensuring businesses have the knowledge to stay ahead.
How to Use It
This report serves as a strategic planning tool for businesses involved in foodservice delivery. It helps operators benchmark performance against competitors, identify growth opportunities, and refine their digital engagement strategies. Suppliers and manufacturers can leverage insights to align their offerings with consumer demand, while investors and analysts can use the report’s market sizing data and forecasts to assess sector resilience and future potential.
Who Is It For?
The UK Foodservice Delivery Market Report 2025 is essential for foodservice operators, suppliers, manufacturers, and investors looking to understand the latest trends and dynamics in the market. Whether you are an established brand, an emerging operator, or a supplier looking to expand into the sector, this report provides the critical insights needed to navigate the evolving landscape and capitalise on market opportunities.
Market Insight
- Market sizing, value growth and CAGR forecast to 2028
- Graph: Key economic indicators, EY Item Club, 2019-2025F
- Graph: Barclaycard consumer spending reports, February 2023-2025
- Delivery share of total eating out market and channel turnover
- Graph: Foodservice delivery channels ranked by estimated delivery turnover share of total channel turnover 2019-2025F
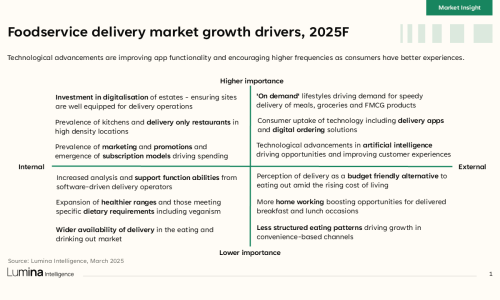
- Key growth and inhibition factors shaping 2025
- Impact of inflation, NI contributions and policy changes on operator costs
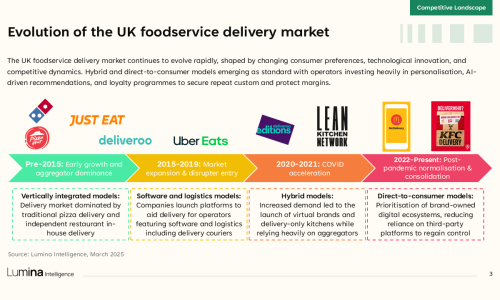
- Evolution of delivery-only kitchens and reach expansion
- Channel-level growth: traditional fast food, branded restaurants, contemporary fast food
- Graph: Leading channel share of foodservice delivery market, 2019-2025F
- Graph: UK foodservice delivery market share of total eating out market, 2019-2025F
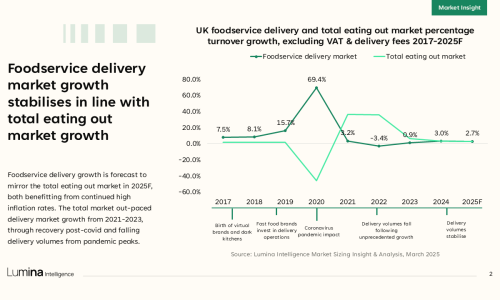
- Comparison of foodservice delivery vs total market growth
- Graph: UK foodservice delivery market value in millions, with percentage growth, 2019-2025F
- Graph: UK foodservice delivery and total eating out market percentage turnover growth, excluding VAT & delivery fees 2017-2025F
- Graph: Foodservice delivery turnover by key channels in millions, 2023-2025F
- Consumer confidence, income disparity and impact on delivery demand
- Graph: GFK consumer confidence, February 2020 – February 2025
- Graph: Average weekly discretionary income by household income group, December 2024, with percentage year-on-year growth
- Key economic and legislative indicators influencing delivery
- Role of mobile, AI and platform optimisation on growth trajectory
Competitive Landscape
- Leading brand performance and delivery turnover forecasts
- Graph: Top 10 foodservice delivery brands by estimated annualised delivery turnover, 2023E-2025F(£m)
- Graph: Top 10 foodservice delivery brands, outlets, 2023-2025F
- Graph: Delivery share of turnover, leading foodservice brands, 2019-2024F
- Market share shifts among key aggregators: Uber Eats, Deliveroo, Just Eat
- Graph: Top 5 delivery brands, UK turnover market share, 2025F
- Graph: Aggregator share of total delivery occasions 2022-2024
- Aggregator strategies: white-label logistics, AI integration, drone delivery
- Subscription and loyalty models to enhance brand equity
- Operator and aggregator partnerships: strategic alignment and control
- Regional dynamics: aggregator share growth by region and in London
- Graph: Aggregator share of total delivery occasions 2022 vs 2024, London only
- Graph: Aggregator share of total delivery occasions 2022 vs 2024, Regions
- Editions and smart kitchens: impact on operational scalability
- Pub and bar sector delivery availability post-pandemic
- Case studies: Domino’s, Burger King, Greggs, Pizza Hut, Papa Johns
- Casual dining: streamlined partnerships and delivery rationalisation
- Emerging fast-growth delivery-first brands and expansion strategies
Consumer Insight
- Graph: Delivery share of total market occasions, Mar-2023- Mar-2025
- Graph: Penetration
- Graph: Delivery- KPIs
- Graph: Channel share of occasions
- Consumer usage patterns and engagement with delivery services
- Graph: Demographic profile of delivery users by age, region, income and household type
- Graph: Delivery Average vs total eating out market: Age Demographic
- Graph: Delivery Average vs total eating out market: Living Arrangements
- Graph: Delivery Average vs total eating out market: Gender
- Graph: Delivery Average vs total eating out market: Social Grade
- Graph: Region share of delivery occasions
- Graph: Age share of delivery occasions
- Graph: Income share of delivery occasions
- Motivations for choosing delivery across different occasions and day-parts
- Graph: Day part share of delivery occasions
- Graph: Delivery – lunch – share and year on year changes
- Graph: Weekday share of delivery occasions
- Graph: Delivery missions by daypart – lunch
- Graph: Delivery missions by daypart – dinner
- Graph: Reason for choosing a venue (Top 10)
- Consumer preferences around brand, health, quality and convenience
- Graph: Delivery psychographics, with year-on-year change and index versus the total market
- Graph: Delivery – restaurant – share and year on year changes
- Trends in delivery behaviour including group and experiential ordering
- Graph: Delivery share of total eating & drinking out occasions, 2023-2024
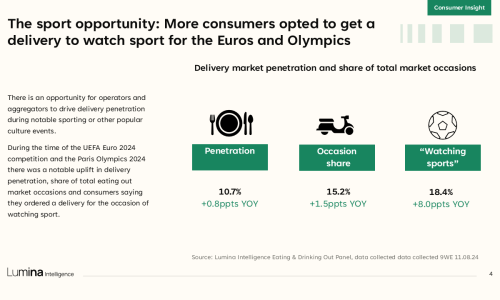
- Graph: Delivery market penetration and share of total market occasions
- Graph: Share of delivery occasions by subchannel, 9WE 11.08.24
- Graph: Brand, delivered occasions (top eight)
- Graph: Brand, delivered occasions (top eight)
- Role of promotions, loyalty schemes and meal deals in influencing behaviour
- Graph: Type of promotion by share of delivery occasions, 2024-2025
- Consumer satisfaction levels with the delivery experience
- Graph: Satisfaction ratings, delivered occasions
- Inclusion and growth of drinks within delivery occasions
- Graph: Food or drink purchases, delivered occasions
- Graph: Drink share of delivery occasions with under-index vs total market
Future Outlook
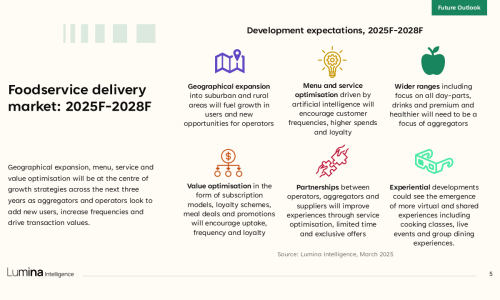
- Forecast market value and growth to 2028F
- Graph: Key economic indicators, EY Item Club, 2023-2028F
- Graph: UK foodservice delivery market value in millions, with percentage growth, 2022-2028F
- Graph: UK foodservice delivery market share of total eating out market, 2023-2028F
- CAGR and projected increase in market turnover
- Graph: Foodservice delivery turnover by key channels in millions, 2022-2028F
- Channel-level future growth by absolute value
- Graph: Foodservice delivery channels ranked by absolute growth in £ millions, 2025F-2028F
- Graph: Channel share of foodservice delivery market, 25F-28F
- Graph: Foodservice delivery channels ranked by estimated delivery turnover share of total channel turnover 2025F-2028F
- Branded restaurant and fast-food growth outlook
- AI integration: recommendation engines, automation and virtual experiences
- Subscription-first business models and platform personalisation
- Impact of business cost increases on delivery operations
- Gig economy legislation, HFSS advertising regulation and EPR fees
- Long-term consumer trends and sustainability imperatives
- Key levers of future growth: frequency, user acquisition, basket value
Brand Insights Available in the UK Foodservice Delivery Market Report 2025
Greggs
- Forecast to lead delivery turnover growth in 2025.
- Insight into Greggs’ strategic alignment with consumer trends and delivery expansion.
Burger King
- Overview of Burger King’s dual delivery strategy using both white-label and aggregator models.
- Analysis of Burger King’s rise into the top 5 UK delivery brands.
Just Eat
- Context on Just Eat’s position amid market consolidation and acquisition activity.
- Insight into platform performance, including user trends and competitive challenges.
- Evaluation of Just Eat’s evolving role in a fragmented aggregator landscape.
Deliveroo
- Breakdown of Deliveroo’s role across delivery models, from virtual brands to hybrid logistics.
- Insight into platform trends including Gross Transaction Value vs. user frequency.
- Analysis of Deliveroo’s consumer dynamics amid inflation and fee pressures.
Uber Eats
- Details on Uber Eats’ share of delivery occasions and expansion of white-label services.
- Evaluation of Uber Eats’ role in reshaping platform partnerships and operator strategy.
KFC
- Included among the UK’s top 5 delivery brands by turnover.
- Insight into KFC’s growth strategy via direct ordering, app engagement, and outlet expansion.
McDonald’s
- Analysis of McDonald’s delivery channel performance and strategic investments.
- Exploration of McDonald’s app-based engagement and operational scale in delivery.
Papa Johns
- Positioned within the top-performing delivery brands in the UK.
- Adoption of dual-platform delivery partnerships to optimise reach and efficiency.
Wingstop
- Insight into Wingstop’s expansion via Editions-style kitchens.
- Focus on virtual brand growth and market entry without physical store presence.
Tortilla
- Analysis of Tortilla’s dual delivery partnership strategy (Uber Eats and Just Eat).
- Context on the broader trend of delivery channel rationalisation.
Popeyes
- Referenced in relation to future event-led delivery opportunities (e.g. World Cup 2026).
- Insight into consumer satisfaction trends in relation to delivery experiences.
Domino’s
- Recognised as a leading delivery brand by UK turnover.
- Insight into Domino’s market share positioning within the competitive set.
Other Brands Mentioned
- Leon
- PizzaExpress
- Subway
- Pret A Manger
- Starbucks
- Costa Coffee
- Wagamama
- Nando’s
- Taco Bell
- Fridays
- Côte
- Itsu
- YO!
- Dishoom
- Pizza Hut
- Five Guys
- Giggling Squid
- Carluccio’s
- Chopstix
Eating & Drinking Out Panel
- Lumina Intelligence’s UK Eating & Drinking Out Panel tracks the behaviour of 1,500 nationally-representative consumers each week, building up to a sample of 78,000 every year, across all eating out channels and day-parts (including snacking)
2020–2025
Market Sizing & Operator Data Index
- Market sizing data tracking the performance of hospitality and grocery operators, based on turnover and outlet numbers
- Extracts from Operator Data Index and wider synthesis with total Eating Out market sizing
- Lumina Intelligence Operator Data Index tracks and forecasts outlet and turnover information for over 400 brands across the eating out market
2018–2028F
Top of Mind Business Leaders Survey
- Lumina Intelligence Top of Mind business leaders survey – targeted at industry professionals across the eating out and grocery retail markets, to understand the trading environment, challenges and growth opportunities
July 2021–2024
Secondary external sources
- Lumina Intelligence also uses external sources including desk research, GFK Consumer Confidence Index and EY Item Club economic indicators


