The UK Wholesale Online Report 2025 is the most comprehensive data-led analysis of the digital wholesale channel across retail and foodservice in the UK.
Powered by Lumina Intelligence’s robust datasets and exclusive industry interviews, the report tracks how operators are adapting to online platforms, how wholesalers are investing in technology, and how AI and automation are redefining the customer journey.
Key themes for 2025 include the balance between online and depot purchasing, cost-conscious operator behaviour, growing efficiency needs, the rise of mobile-first strategies, and the transformative impact of AI on marketing, ordering and customer engagement.
With actionable insight, case studies and forecasts, this report equips wholesalers, suppliers and digital partners to identify growth opportunities, optimise customer journeys and future-proof their ecommerce strategies.
Who is this report for?
This report is essential for wholesalers seeking to enhance digital performance and customer engagement, suppliers developing omnichannel strategies to reach retailers and foodservice operators, technology partners supporting ecommerce, data and AI adoption, and investors and analysts assessing future growth, innovation and market potential in eB2B.
What questions will this report help you answer?
- How is the wholesale sector evolving as ecommerce becomes the dominant route to market?
- What digital behaviours and motivations define retailer and foodservice operators online?
- How can wholesalers optimise the customer journey to boost conversion and loyalty?
- Which technologies and AI innovations are reshaping wholesale operations and marketing?
- What strategies drive efficiency, value creation and customer engagement online?
- How will economic pressures, demographic shifts and sustainability trends shape future growth?
Extended Table of Contents:
Wholesale Online Landscape
- Wholesale Market Overview – Summary of the UK wholesale sector’s composition, including retail, catering, and hybrid operators, with analysis of online growth and channel diversification.
- Graph: Market structure breakdown – share of retail, catering, and hybrid wholesalers, 2024–2025.
- Economic Confidence & Trading Conditions – Review of business confidence and operating challenges affecting the wholesale sector.
- Graph: ICAEW Business Confidence Index – Retail & Wholesale, 2015–2025.
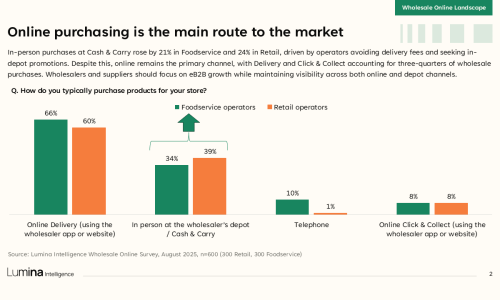
- Routes to Market – Examination of purchasing channels and the continuing shift toward digital and delivery models.
- Graph: Purchasing channels by customer type – Online, Depot, Telephone, 2024–2025.
- Shopping Missions & Basket Behaviour – Analysis of purchasing motivations, including restocking frequency, promotional buying, and basket value dynamics.
- Graph: Primary shopping missions – 2024 vs 2025 comparison.
- Order Frequency & Customer Type – Comparison of shopping frequency and average spend across retail and foodservice operators.
- Graph: Average order frequency and spend – Retail vs Foodservice, 2025.
- Online Product Categories – Overview of the top-selling product categories online, contrasting retail and foodservice priorities.
- Graph: Top 10 online product categories – Retail vs Foodservice, 2025.
- Online VS In-Depot Product Preferences – Insight into fresh and short-shelf-life product insight tied with online VS physical purchasing.
- Graph: Online VS cash & carry product purchase preference – August 2025.
- Graph: Online VS cash & carry – comparison by reasons, August 2025.
- Case Studies: Operator Innovation – Overview of digital developments from JJ Foodservice, Diageo One, Booker, and Woods Foodservice.
- Visuals: Screenshots and examples of wholesale digital strategy implementation.
- Key Developments in the Online Market – Summary of major technology trends shaping 2025, including AI-led personalisation, content quality, and platform consolidation.
- Graph: Key wholesale innovation themes – AI, content accuracy, and personalised engagement, 2025.
Path to Purchase
- Journey Overview – Mapping of the wholesale online customer journey from discovery to retention, identifying optimisation opportunities.
- Graph: Path-to-purchase model – Awareness → Consideration → Purchase → Retention.
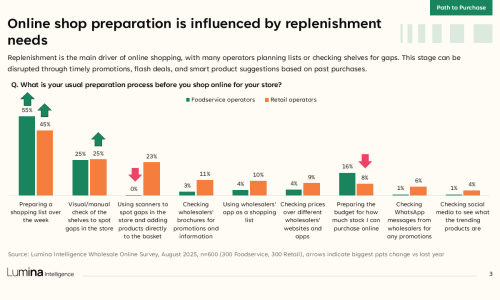
- Pre-Shop Behaviour – Analysis of shopper preparation methods, including list-making, prior research, and use of messaging platforms.
- Graph: Preparation activities before ordering online – Retail vs Foodservice, 2025.
- Landing Pages & Entry Points – Evaluation of the main user access points into ecommerce platforms and their conversion effectiveness.
- Graph: Landing page entry share – Homepage, Login, and Product pages, 2024–2025.
- Feature Prioritisation – Assessment of website features considered most important by operators in each channel.
- Graph: Website attributes rated “very important” – Retail vs Foodservice comparison.
- Product Discovery & Engagement – Measurement of session duration, engagement rates, and key drop-off points in the browsing journey.
- Graph: Session length and conversion rate correlation – 2024–2025 data.
- Device Performance & Conversion – Comparison of device usage, average order value, and conversion rates across desktop, mobile, and tablet.
- Graph: Device share of sessions and purchases – Retail vs Foodservice, 2024–2025.
- Graph: Average order value by device – 2024–2025 comparison.
- Case Study: Ocado UX Analysis – Example of best practice in online retail navigation and search optimisation.
Disrupting the Online Journey
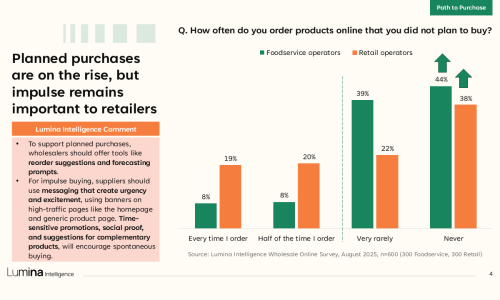
- Impulse vs Planned Purchasing – Comparison of planned restocking versus spontaneous, promotion-led buying across foodservice and retail.
- Graph: How often operators buy unplanned items online – Foodservice vs Retail (2025).
- Banner Creative Effectiveness – Illustration of best-practice banner design to trigger action with clear value, brevity and CTA.
- Visual: Parfetts homepage banner example (promotional CTA and contrast use).
- Foodservice: Drivers of Unplanned Buys – The role of promotions, NPD and perceived sell-through in triggering incremental items.
- Graph: Motivations for last unplanned purchase – Foodservice Top 5 (2024 vs 2025).
- Foodservice: Purchase Decision Factors – Commercial drivers (profit margin, top sellers, case size) vs brand cues when choosing products.
- Graph: Importance of product features when buying – Foodservice (2024 vs 2025).
- Display Media Usage – Placement patterns (homepage/leaderboard) and static banner roles in upper-funnel activation.
- Visuals: Hancocks seasonal NPD; Bestway POR message; Sugro superlative ad.
- Foodservice: Promotion Preferences – Mechanics most likely to convert (e.g., multi-buys) for tight-margin operators.
- Graph: Desired promotions on wholesaler sites/apps – Foodservice Top 5 (2024 vs 2025).
- Foodservice: Weekly ATB Rhythm – Day-of-week add-to-basket peaks, with Sunday as the prime activation day.
- Graph: Add-to-Basket Rate by day of week – Foodservice (Jan–Jun 2024 vs 2025).
- Foodservice: Device x Day Patterns – When desktop and mobile deliver the strongest add-to-basket behaviour.
- Graph: Add-to-Basket Rate by day and device – Foodservice (2025).
- Foodservice: Device x Day Conversion – Purchase conversion high points by device across the trading week.
- Graph: Purchase Conversion Rate by day and device – Foodservice (2025).
- Foodservice: Hourly ATB Trend – Late-evening basket building, with a consistent 22:00 peak year-on-year.
- Graph: Add-to-Basket Rate by hour of day – Foodservice (Jan–Jun 2024 vs 2025).
- Foodservice: Hourly Device Split – Post-shift desktop peaks vs steady mobile replenishment (incl. early-hours spikes).
- Graph: Add-to-Basket Rate by hour and device – Foodservice (2025).
- Retail: Drivers of Unplanned Buys – Promotions, NPD and PMPs as primary triggers for incremental purchasing.
- Graph: Motivations for last unplanned purchase – Retail Top 5 (2024 vs 2025).
- Retail: Purchase Decision Factors – Balance of top sellers, brand, promotion, and profit margin in ranging decisions.
- Graph: Importance of product features when buying – Retail (2024 vs 2025).
- Brand-Led Basket Building – Unified brand campaigns to simplify choice and grow baskets.
- Visual: Parfetts multi-banner brand focus example.
- Retail: Promotion Preferences – Strong pull of discounted NPD vs other mechanics (multi-buys, freebies).
- Graph: Desired promotions on wholesaler sites/apps – Retail Top 5 (2024 vs 2025).
- Retail: Weekly ATB Rhythm – Growing midweek momentum, with Sunday still key for planning.
- Graph: Add-to-Basket Rate by day of week – Retail (Jan–Jun 2024 vs 2025).
- Retail: Device x Day Patterns – Tablet midweek intent; mobile/desktop Sunday surges.
- Graph: Add-to-Basket Rate by day and device – Retail (2025).
- Retail: Device x Day Conversion – Tablet’s midweek purchase intent vs desktop’s Monday completions.
- Graph: Purchase Conversion Rate by day and device – Retail (2025).
- Retail: Hourly ATB Trend – Evening shopping rising sharply vs last year (notably 21:00–23:00).
- Graph: Add-to-Basket Rate by hour of day – Retail (Jan–Jun 2024 vs 2025).
- Retail: Hourly Device Split – Mobile ATB peaking late-afternoon; desktop strongest later in the evening.
- Graph: Add-to-Basket Rate by hour and device – Retail (2025).
- Monetary vs Product-Driven Segmentation – Relative weight of financial vs product factors in purchase decisions by sector.
- Graph: Monetary- vs product-driven purchase factors – Foodservice vs Retail (2025).
- Most Effective Campaign Types – Which promotional campaign formats leaders find most compelling by channel.
- Graph: Most effective promotional campaign types – Foodservice vs Retail (2025).
- Preferred Communication Channels – Channel mix shift (email still dominant; WhatsApp and print rising).
- Graph: Preferred notification channels – Foodservice and Retail (Top 5, 2025).
- WhatsApp Engagement Benchmarks – Read-rate performance and the uplift from segmentation using WhatsApp Business API.
- Graph: WhatsApp message read within 1 hour / 24 hours; open-rate uplift with targeting (2025).
- Graph: One-hour read-rate ranking by day and peak send times (heat points at 11:00, 14:00, 15:00).
- Message Design Best Practice – Elements that lift response for transactional vs non-transactional sends.
- Visuals: Transactional and non-transactional message frameworks (copy, media, CTA, flows).
- Wholesale Case Examples on WhatsApp – Scale, segmentation, and outcomes for Bestway, Booker, and Barry Group.
- Visuals: Channel stats and usage notes by wholesaler (audience size, read rates, sales uplift).
Boosting Efficiencies
- Search Functionality & Navigation – Analysis of search accuracy, failure rates, and product findability across operators.
- Graph: Search success rate by operator type – Retail vs Foodservice, 2025.
- User Journey Friction Points – Identification of high exit-rate pages and factors influencing user drop-offs.
- Graph: Sessions per transaction and exit page analysis – 2024–2025 comparison.
- Top Search Insights – Overview of the most common queries and their relevance to product mix and brand prominence.
- Graph: Word cloud of top 200 search terms – Retail and Foodservice, 2025.
- Brand Discovery & Product Presentation – Assessment of how “Shop by Brand” and improved content supports decision-making.
- Case Study: b2b.store & Mars Wrigley – Perfect Content – Product imagery and metadata excellence.
- Customer Service & Post-Order Corrections – Evaluation of communication methods and reasons for order changes.
- Graph: Frequency and cause of order amendments – Stock availability vs Forgotten items, 2025.
- Graph: Communication channels used – Telephone, Email, WhatsApp, 2025.
- Service Usefulness Ratings – Measurement of wholesaler service performance across retail and foodservice users.
- Graph: Customer perception of wholesaler service usefulness – 2025.
- Case Study: Swizzels Channel Growth Strategy – How targeted brand initiatives drive penetration in foodservice.
A Moment with the Experts in AI
- Interview: Rob Mannion (b2b.store) – Exploration of AI-native ecommerce systems and the role of automation in scaling efficiency.
- Interview: Alex Kiely (Choco) – Insights on AI-driven ordering systems and personalisation in hospitality supply.
- Interview: Gabriel Van Heerden (Orderlion) – Discussion on predictive analytics, machine learning, and streamlined procurement.
- Interview: Steve King (Dragonfly AI) – Analysis of visual attention modelling and creative intelligence in ecommerce optimisation.
Future of Wholesale Online
- Regulatory & Policy Outlook – Review of environmental and health-related regulations (EPR, DRS, HFSS) and their implications for wholesalers.
- Graph: Key regulatory changes and expected impact areas – 2025–2027 forecast.
- Economic Outlook & Forecasts – Assessment of macroeconomic indicators shaping the sector’s trajectory.
- Graph: UK economic indicators – GDP, CPI, and consumer spending, 2024–2029F.
- Consumer & Demographic Shifts – Analysis of emerging trends driving wholesale demand and buyer expectations.
- Graph: Long-term consumer trend ranking – Value, Sustainability, Digital convenience, 2023–2025.
- Technology & Q-Commerce Innovation – Case studies exploring the evolution of local and rapid delivery solutions.
- Visuals: JW Filshill and Snappy Shopper – examples of digital innovation and social commerce.
- AI in Sustainability & Waste Reduction – Review of AI’s role in enhancing stock management and reducing waste.
- Graph: Sustainability focus areas – Waste reduction, Packaging optimisation, Energy efficiency.
- Localism & Ethical Sourcing – Examination of how wholesalers and buyers are embracing provenance and conscious consumption.
- Graph: Share of customers prioritising local and ethical sourcing – Retail vs Foodservice, 2025.
- Health & Wellness Trends – Evaluation of health-oriented product development and HFSS compliance strategies.
- Graph: Health and nutrition initiatives prioritised by businesses – 2025.
- Case Study: Bestway’s Good Food Retail Network – driving healthier product adoption.
This report combines multiple Lumina Intelligence’s leading data sources, including:
- b2b.store platform data from 15 UK wholesalers’ websites and apps (Jan–Jun 2024–2025)
- Retailer Attitudes & Behaviours Study (400 retailer interviews, May–Jun 2025)
- Bespoke Wholesale Study (600 operator surveys, Aug 2024–2025)
- AI Expert Interviews with industry leaders conducted jointly with The Grocer (Sept–Oct 2025)


